
I briefly mentioned in a earlier post that I was reading a book called “Blue Ocean Strategy” by W. Chan Kim and Renee Mauborgne. The book touches on many different aspects of creating a winning business and contains some thought provoking insights into companies that have applied the strategy. Today I would like to review some of the tools that are used to evaluate businesses starting with “The Strategy Canvas”.
The purpose of the strategy canvas is two fold. It captures the state of the current market which helps you understand where the competition is currently investing its time and money and then compares that to how well your company performs in each of the categories. The resulting graph is a value curve showing the companies performance across the key industry factors.
The example in the book for the strategy canvas looks at the American wine industry. When customers were polled, the key factors were determined to be Price, the terminology used to define the wines pedigree, marketing, aging/Quality, Vinyard Legacy, Complexity and range. These become the points along the horizontal axis of the strategy canvas. The vertical axis represents your ability to perform in each category from low to high. Permium wines score high across the board while Budget wines score in the middle.
If you are starting a new wine company and you want to be successful you don’t want to try to out-compete the incumbents. You want to shift the strategy canvas of the industry. Two things you could look at would be Value vs Cost and Customers vs Non-Customers.
At this stage of the analysis the book proposes a “Four Actions Framework” which looks at what factors the industry takes for granted that should be eliminated, which factors will reduce cost well below the industry standard, which factors should be raised above the industry standard and which factors should be created that would be new to the industry.
A wine company in Australia did this analysis by looking at both wine and non-wine drinkers. They created a wine that appealed to beer and cocktail drinkers, pitched it as a social drink and made the packaging fun. They didn’t spend any money promoting their brand or their winery and put that savings into reducing the price. In one year “Yellow Tail” surpassed imported wines from France and Italy into the USA. In 2003 it was the number one selling red wine.
When we go back to the strategy canvas we get something like this.
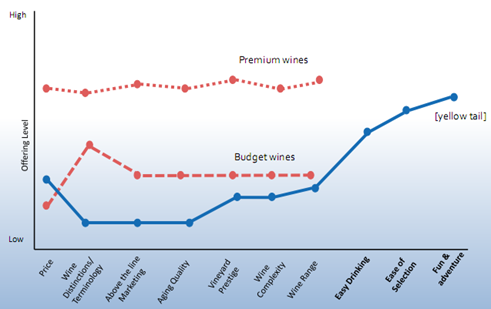
So three new categories were added along the horizontal scale of the graph that resulted in differentiating the wine from it’s competitors allowing it win in a highly competitive market. This differentiation is what the book calls a blue ocean and the strategy canvas is the starting point. The final tool that is used to analyze you business is the Eliminate-Reduce_Raise_Create grid. In the case of the example above, it would look like…

This just drives home the strategy that you plan to use to create your blue ocean. It also provides a way to communicate your plan to your staff.
Many of use are stuck in highly competitive red oceans and miss the opportunity to differentiate ourselves in the eyes, hearts and minds of our customers. Think about what is important to you customers and make a strategy canvas. Now look at who does not use your product and identify what would have to change to win those customers. Do the analysis to determine what is not important, quantify the new things you need and plot the course to your blue ocean.